Prediction question
The model estimates diabetes risk using routinely measured variables. It does not prove why diabetes occurs.
This case study applies the Module 1 foundation workflow to a diabetes prediction problem. The aim is not only to fit a logistic regression model, but to interpret the model like a biostatistician: define the prediction question, check predictor timing, evaluate discrimination and calibration, study threshold behaviour and report limitations honestly.
Outcome
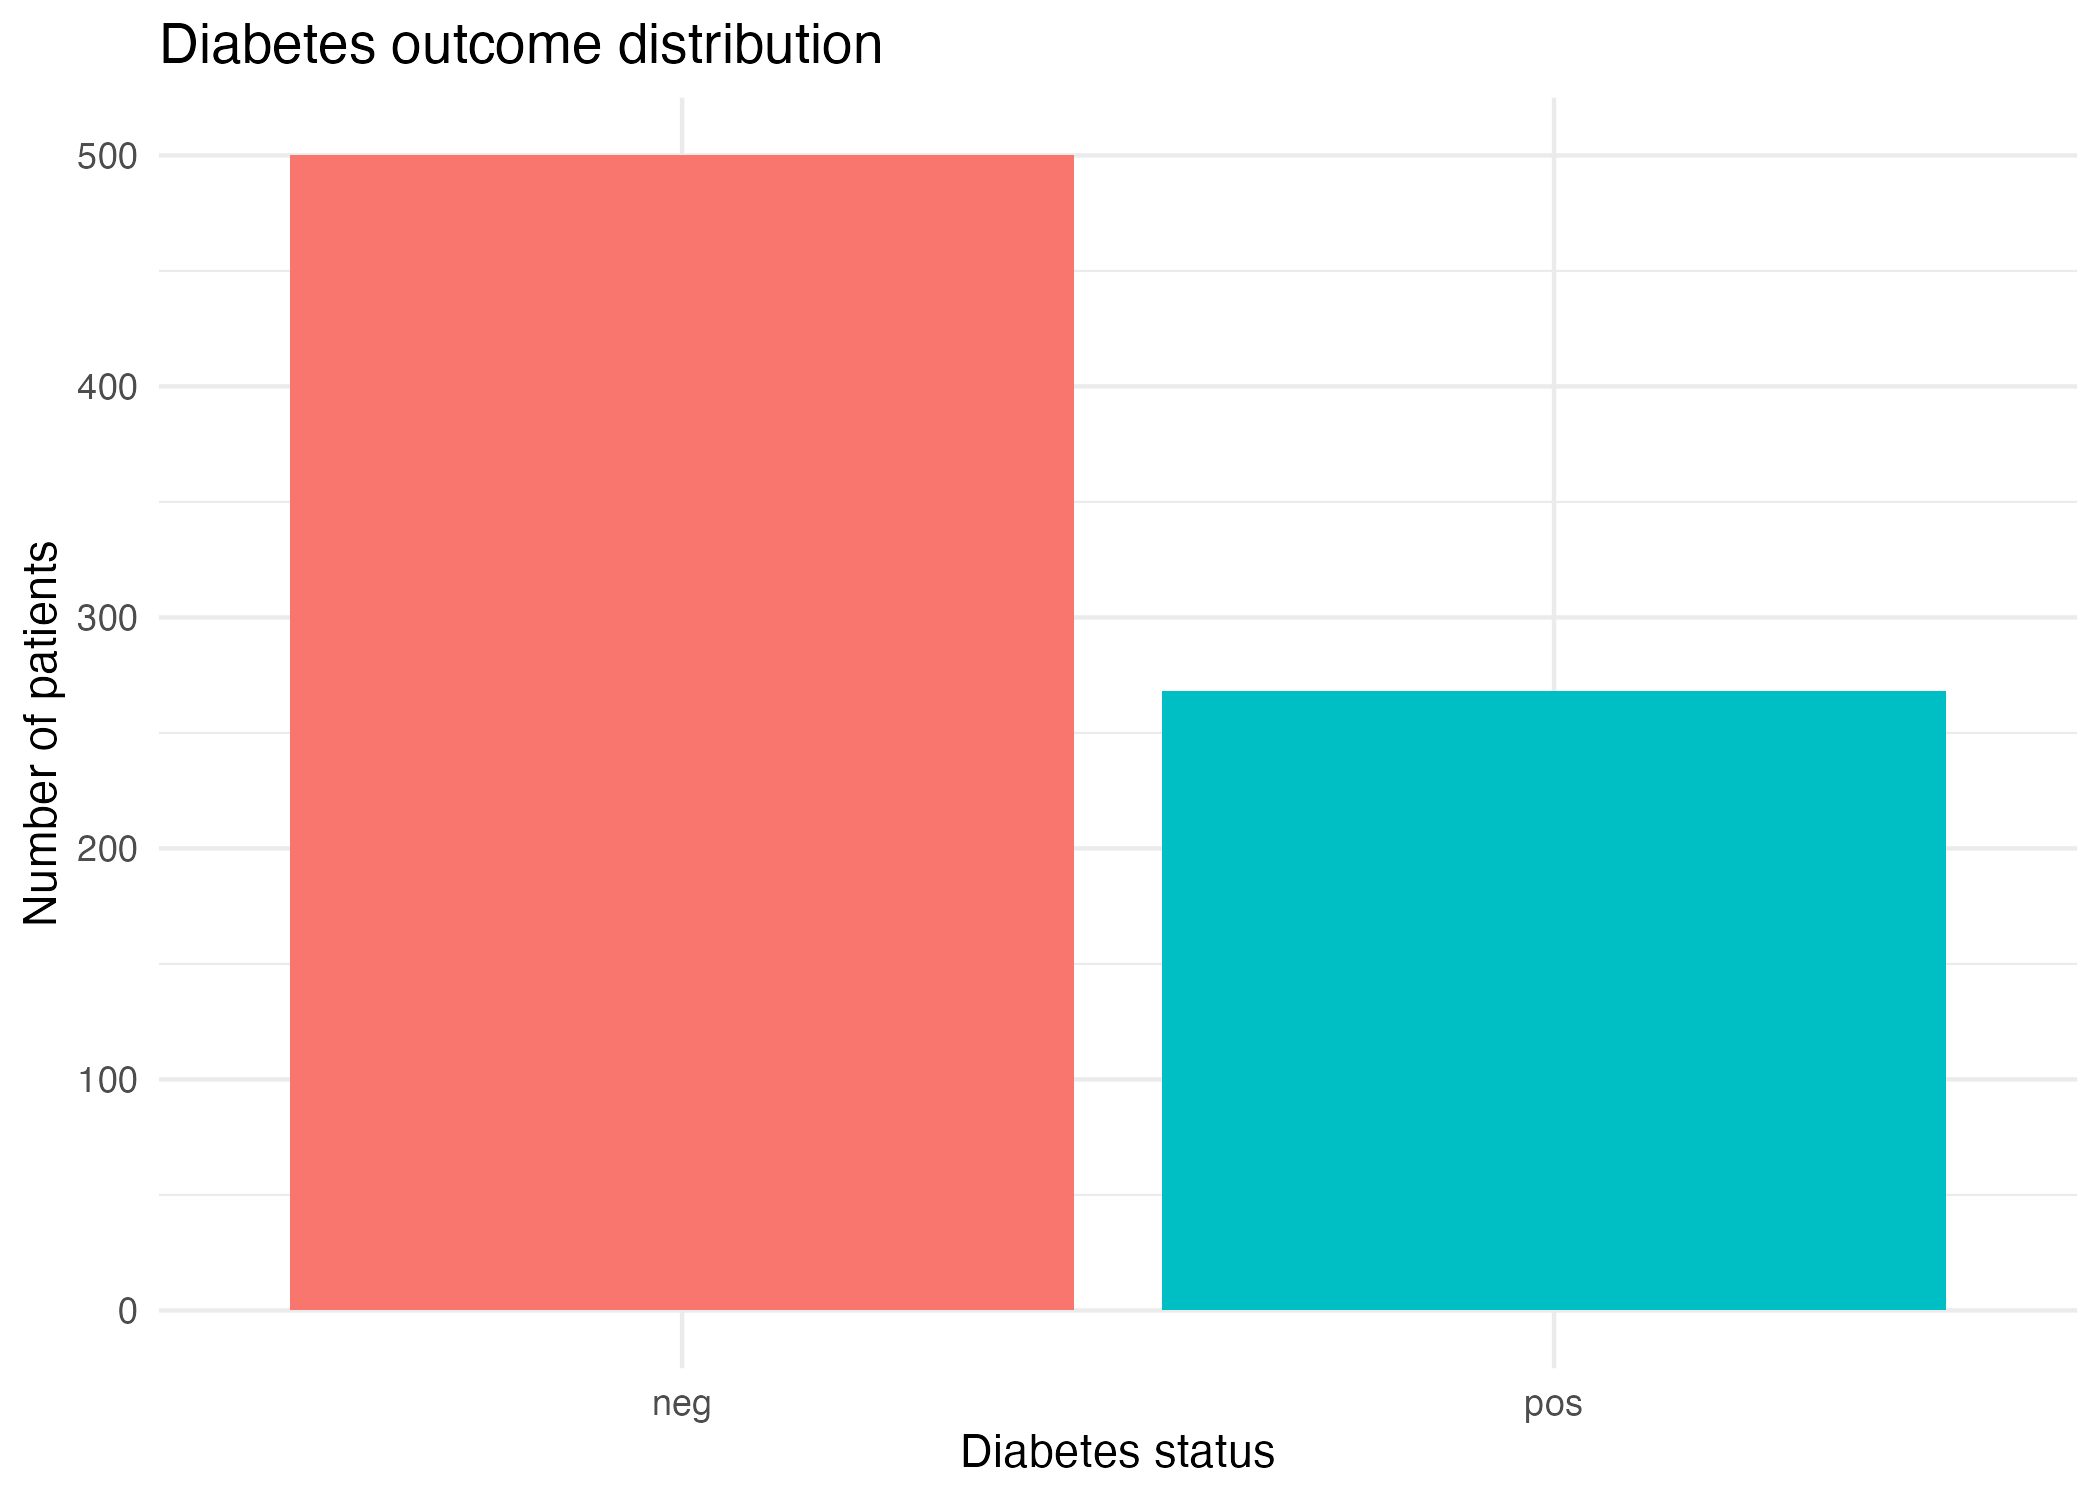
Diabetes status
Model
Logistic regression
Task
Binary prediction
Main result
AUC 0.838
Executive summary
The model shows useful discrimination for diabetes status, with test-set AUC = 0.838 and Brier score = 0.149. At the default threshold of 0.50, the model achieves accuracy = 0.779, sensitivity = 0.623 and specificity = 0.861.
The model is more specific than sensitive at threshold 0.50. It correctly identifies most diabetes-negative patients, but misses some diabetes-positive patients. This matters because a model intended for screening may require higher sensitivity.
The key lesson is that performance is not one number. AUC, calibration, sensitivity, specificity, predictive values, thresholds, leakage risk and clinical consequences all need to be interpreted together.
This is a useful teaching model, not a deployable clinical tool. It demonstrates a responsible prediction workflow, but external validation, calibration assessment and clinical usefulness analysis would be needed before real-world use.
Results first
Accuracy
0.779
Overall proportion correctly classified.
Useful as a broad summary, but not enough because the outcome is imbalanced.
Sensitivity
0.623
33 of 53 positives detected.
The model misses 20 diabetes-positive patients at threshold 0.50.
Specificity
0.861
87 of 101 negatives correctly identified.
The model is stronger at identifying diabetes-negative patients.
PPV
0.702
Precision among predicted positives.
When the model predicts positive, about 70% are truly positive in this test set.
NPV
0.813
Reassurance among predicted negatives.
When the model predicts negative, about 81% are truly negative in this test set.
AUC
0.838
Useful discrimination.
The model has useful ranking ability, but AUC alone does not prove clinical usefulness.
Brier score
0.149
Prediction error for probabilities.
Lower is better. It summarises how close predicted probabilities are to observed outcomes.
Threshold
0.50
Default classification cut-off.
The default threshold is not automatically the best clinical threshold.
The model has useful discrimination, but at threshold 0.50 it is more conservative than sensitive. It produces fewer false positives, but it misses 20 diabetes-positive patients. Whether this is acceptable depends on the clinical purpose of the model.
Clinical question
The outcome is diabetes status, coded as positive or negative. The model uses routinely measured patient characteristics to estimate the probability that a patient is diabetes-positive.
Prediction question: using available clinical variables, can we estimate a patient’s probability of diabetes?
This is a binary prediction problem. However, the goal is not simply to output “positive” or “negative”. In medical machine learning, predicted probabilities, thresholds, false positives, false negatives and clinical actions all matter.
Dataset and predictors
This case study uses the same diabetes prediction setting that appears across the early course modules. Keeping the dataset consistent helps learners focus on how the modelling ideas develop: supervised learning, logistic regression, validation, AUC, calibration, thresholds, leakage and reporting.
| Variable | Clinical meaning | Timing check | Interpretation caution |
|---|---|---|---|
| pregnant | Number of pregnancies | Should be available before prediction | Context-dependent; interpret carefully across populations. |
| glucose | Plasma glucose concentration | Should be available before prediction | Strong predictive marker, but not automatically causal evidence. |
| pressure | Diastolic blood pressure | Should be available before prediction | May contribute weakly depending on the population. |
| triceps | Triceps skinfold thickness | Should be available before prediction | Measurement quality can vary. |
| insulin | Serum insulin | Should be available before prediction | May be missing or clinically unavailable in some settings. |
| mass | Body mass index | Should be available before prediction | Predictive, but interpretation should avoid causal overclaiming. |
| pedigree | Diabetes pedigree function | Should be available before prediction | Represents family-history-related risk information. |
| age | Age in years | Available before prediction | Usually safe from leakage, but may interact with other risk factors. |
Workflow
State exactly what the model should predict, for whom, and at what point in the clinical pathway.
Output: Can routinely measured clinical features predict diabetes status?
Inspect the outcome, predictors, class balance, missingness and whether each variable has a plausible clinical meaning.
Output: Outcome: diabetes status. Predictors include glucose, BMI/mass, age, pressure, insulin and pedigree.
Ask whether every predictor would be available at the true prediction time.
Output: No predictor should contain future diagnosis, treatment or follow-up information.
Fit the model on training data and evaluate it on held-out test data.
Output: Training/test separation gives a more honest estimate of generalisation.
Use logistic regression because the outcome is binary and the aim is risk prediction.
Output: The model estimates predicted probability of diabetes.
Use ROC and AUC to assess whether predicted risks rank positives above negatives.
Output: AUC = 0.838, suggesting useful discrimination.
Convert predicted probabilities into classes and examine sensitivity, specificity, PPV and NPV.
Output: At threshold 0.50, sensitivity = 0.623 and specificity = 0.861.
Explain what the model can and cannot support. Avoid claiming clinical readiness from one internal case study.
Output: External validation, calibration assessment and clinical usefulness analysis are still needed.
Confusion matrix
The model produces predicted probabilities. To create predicted classes, we apply a threshold. At threshold 0.50, patients with predicted risk at or above 0.50 are classified as diabetes-positive.
| Predicted negative | Predicted positive | Clinical meaning | |
|---|---|---|---|
| Observed negative | 87 | 14 | 87 true negatives and 14 false positives. |
| Observed positive | 20 | 33 | 33 true positives and 20 false negatives. |
False negatives are diabetes-positive patients predicted as negative. In this case study, there are 20 false negatives at threshold 0.50. For screening, this may be concerning because these patients may not receive timely follow-up.
False positives are diabetes-negative patients predicted as positive. In this case study, there are 14 false positives at threshold 0.50. These may cause extra testing, cost or anxiety.
Discrimination
The ROC curve shows the trade-off between sensitivity and specificity across many thresholds. The AUC summarises discrimination: how well the model ranks diabetes-positive patients above diabetes-negative patients.
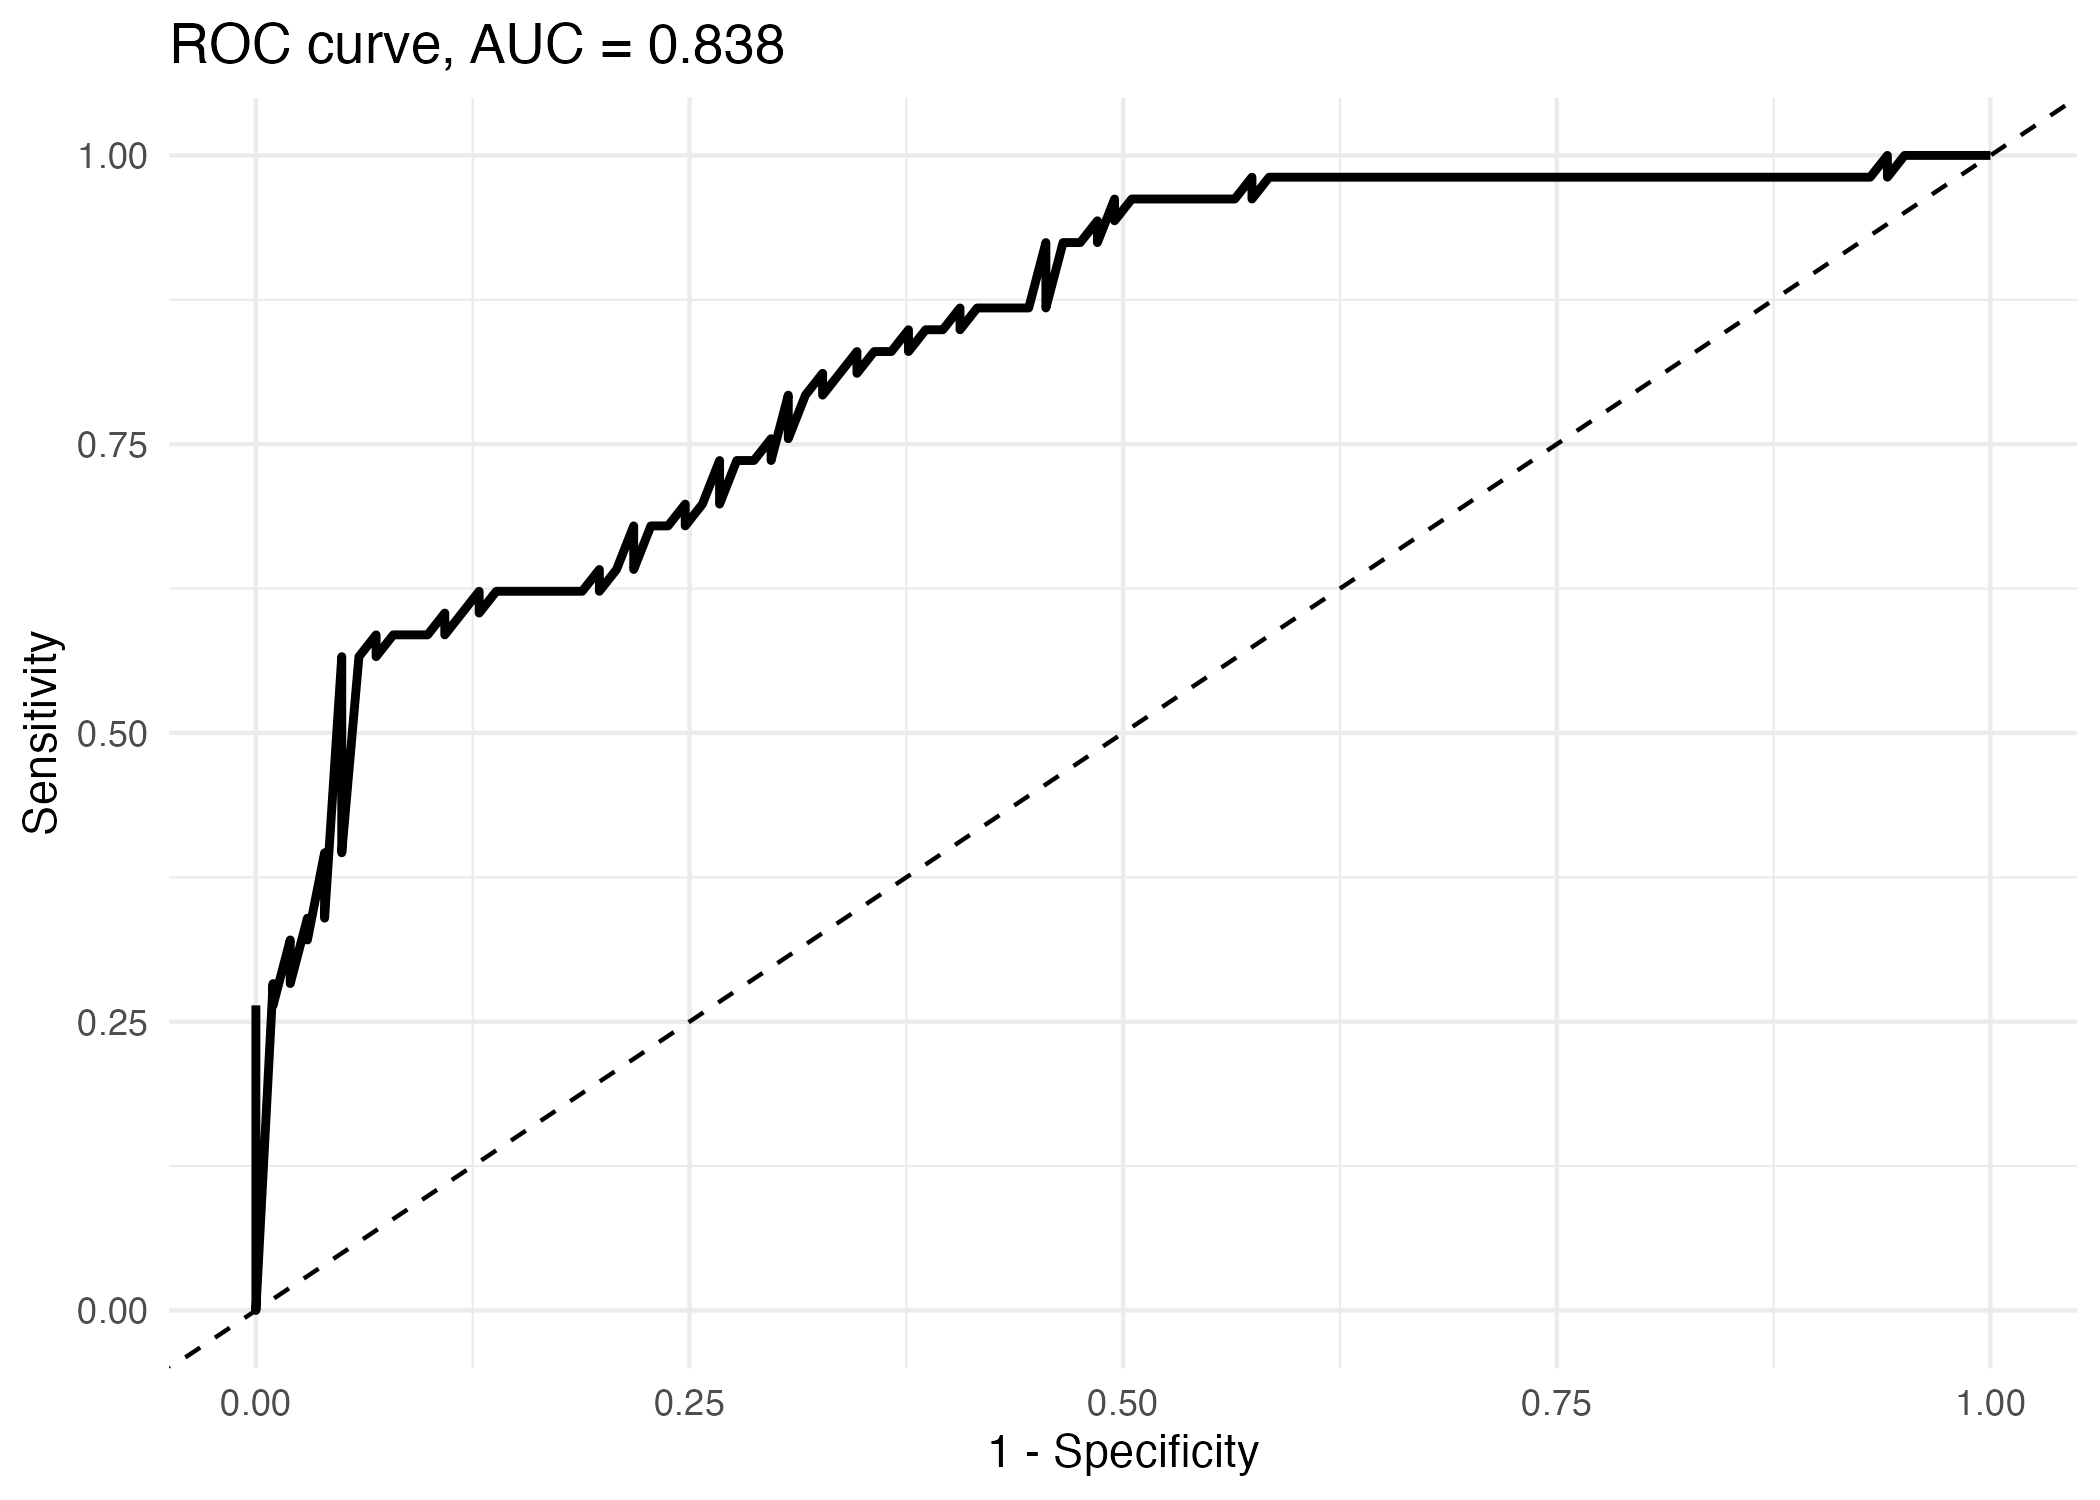
AUC can be interpreted as a ranking measure. If we randomly choose one diabetes-positive patient and one diabetes-negative patient, an AUC of 0.838 means the model often assigns a higher predicted risk to the diabetes-positive patient. However, AUC does not tell us whether predicted probabilities are numerically accurate or whether a chosen threshold is clinically appropriate.
Calibration
Calibration asks whether predicted probabilities agree with observed outcome frequencies. A model can have good AUC but still give poorly calibrated risk estimates. This matters because clinical decisions often use the predicted probability itself, not only the rank order.
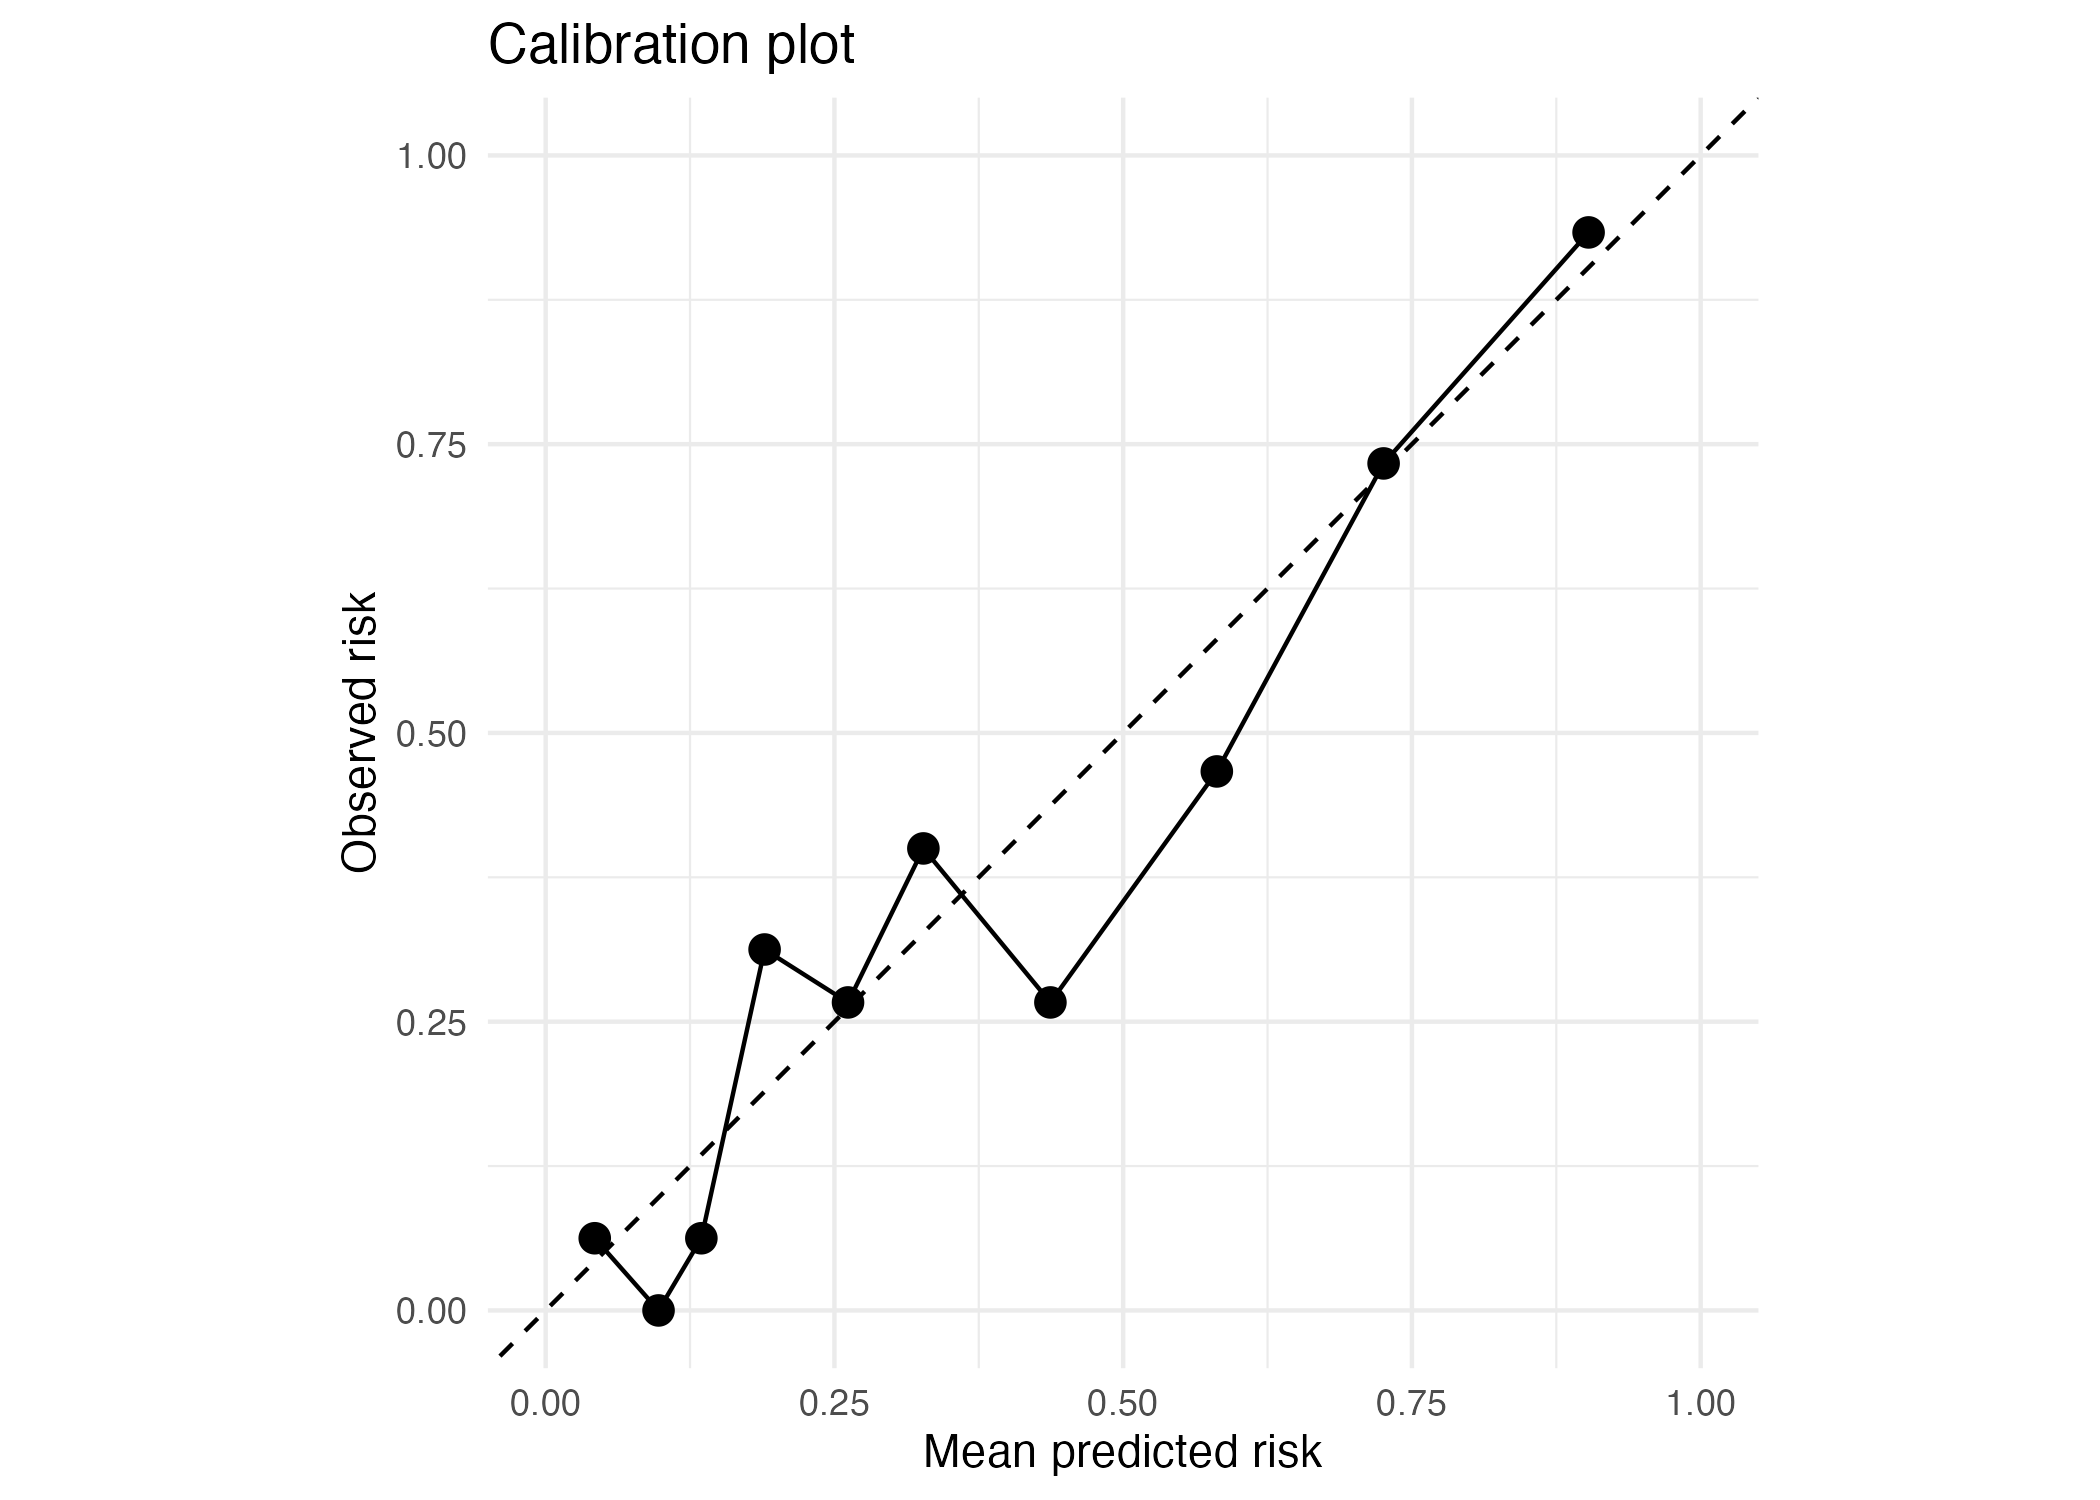
The Brier score measures the average squared difference between observed outcomes and predicted probabilities. It rewards predictions that are both confident and correct, and penalises confident wrong predictions. The value is useful for comparing models, but it should be reported with discrimination and threshold-based metrics.
Interactive threshold lab
A threshold converts predicted probabilities into predicted classes. The default threshold of 0.50 is not automatically best for medical decision-making. Move the slider to see how the model changes.
Accuracy
0.779
Sensitivity
0.623
Specificity
0.861
PPV
0.702
NPV
0.813
True positive
33
False positive
14
True negative
87
False negative
20
Conservative; fewer false positives but misses more diabetes-positive patients.
This threshold is relatively specific. It is better at ruling out diabetes-negative patients than detecting every diabetes-positive patient.
| Threshold | Accuracy | Sensitivity | Specificity | PPV | NPV | Interpretation |
|---|---|---|---|---|---|---|
| 0.20 | 0.695 | 0.925 | 0.574 | 0.544 | 0.936 | Very sensitive; useful for screening but creates more false positives. |
| 0.30 | 0.753 | 0.774 | 0.743 | 0.612 | 0.862 | More balanced; detects more positives than threshold 0.50. |
| 0.40 | 0.766 | 0.698 | 0.802 | 0.649 | 0.835 | Moderately balanced; still more sensitive than threshold 0.50. |
| 0.50 | 0.779 | 0.623 | 0.861 | 0.702 | 0.813 | Conservative; fewer false positives but misses more diabetes-positive patients. |
| 0.60 | 0.766 | 0.509 | 0.901 | 0.730 | 0.777 | Highly specific; may be useful when false positives are costly. |
| 0.70 | 0.747 | 0.415 | 0.921 | 0.733 | 0.750 | Very conservative; many diabetes-positive patients may be missed. |
Interpretation checklist
The model estimates diabetes risk using routinely measured variables. It does not prove why diabetes occurs.
The model should only be applied to patients similar to the population represented in the dataset.
Every predictor must be available before the model is used. Future information would create leakage.
AUC = 0.838 suggests the model separates positives from negatives reasonably well.
The calibration plot should be reviewed because good ranking does not guarantee accurate probabilities.
Threshold 0.50 gives higher specificity than sensitivity. It may be too conservative for screening.
A model is useful only if its predictions can support a meaningful action.
External validation and fuller clinical evaluation are needed before real-world use.
Limitations
Accuracy of 0.779 hides the balance between false negatives and false positives.
At threshold 0.50, the model misses 20 diabetes-positive patients.
AUC tells us about ranking, not whether probabilities are numerically accurate.
The best threshold depends on the consequences of false positives and false negatives.
Performance in one teaching dataset does not guarantee performance in another population.
Model coefficients and predictors should not be interpreted as causal effects.
Clinical variables can be noisy, missing, differently measured or unavailable in real workflows.
A risk score is useful only if it supports an action such as follow-up, testing or monitoring.
Report-style conclusion
A logistic regression model was fitted to predict diabetes status using routinely measured clinical characteristics. The model achieved AUC = 0.838 and Brier score = 0.149 in the test data, suggesting useful discrimination and moderate probability accuracy in this educational example. At the default threshold of 0.50, accuracy was 0.779, sensitivity was 0.623 and specificity was 0.861. The model was therefore more specific than sensitive, correctly identifying most diabetes-negative patients but missing 20 diabetes-positive patients. Threshold analysis showed that lower thresholds increased sensitivity but produced more false positives, while higher thresholds increased specificity but missed more positives. This model should be interpreted as a teaching example of a prediction workflow, not as a clinically deployable tool. External validation, fuller calibration assessment and evaluation of clinical usefulness would be needed before real-world use.
Do not write: “The model is good because accuracy is 0.779.” Accuracy alone is incomplete. A strong case-study interpretation must discuss sensitivity, specificity, AUC, calibration, threshold choice, false positives, false negatives, leakage risk and limitations.
Case study conclusion
The diabetes risk model shows useful discrimination with AUC = 0.838 and Brier score = 0.149. At threshold 0.50, it is more specific than sensitive. This makes it relatively conservative. For screening, a lower threshold may be more appropriate, but that decision must be justified by the clinical context.